Actuarial Data Science
An Open Learning Resource

actuarial data science, open educational resource, data science lifecycle, statistical machine learning, insurance, teaching
Abstract
This report introduces Actuarial Data Science, an open learning resource (OLR) that covers an end-to-end problem-solving process with data science techniques to tackle data problems in a business context. Developed alongside Actuarial Data Science Applications (ACTL4305/5305) at UNSW Sydney since 2020, the resource is aligned with the Actuaries Institute Part II Data Science Principles syllabus.
The OLR is organised around the Data Science Lifecycle (DSL), a six-step methodology adapted from the Actuarial Control Cycle. Lecture content spans data visualisation, manipulation, and cleaning, shrinkage and generalised linear models, random forests, gradient boosting, and neural networks, model assessment and selection, stakeholder communication, and the Ethical AI Lifecycle. Hands-on labs in R require learners to implement each stage in reproducible R Markdown reports. An embedded industry case competition, the Actuarial Datathon, connects classroom methods to insurer, consulting, and venture-capital partner contexts.
The full resource, including interactive HTML lectures, downloadable slide decks, and lab materials, is available at datascience.feihuang.org. The overview report is available on SSRN (https://papers.ssrn.com/sol3/papers.cfm?abstract_id=6955338). A versioned archive of the open learning resource is also maintained on Zenodo (https://doi.org/10.5281/zenodo.20718647).
Keywords. actuarial data science, open educational resource, data science lifecycle, statistical machine learning, insurance, teaching.
1 Introduction
With the rise of AI and big data, every firm has effectively become a data-driven enterprise. Whether it is supermarkets, hairdressers, restaurants, or dentists, businesses of all types are collecting data on customer behaviour and engagement. We are living in a data-driven era, where data has become one of the most valuable assets for businesses. However, possessing data alone does not automatically translate into insights or business value. It is crucial to apply appropriate data science techniques to extract meaningful insights and communicate those findings effectively to stakeholders.
There are many textbooks available today that cover data science, statistical methods, and machine learning techniques. What does this OLR offer that is different? While many excellent data science textbooks exist, they often focus on individual techniques or models without addressing the entire problem-solving process in a business setting. In contrast, this OLR aims to equip readers with the skills to solve data problems in real-world business environments. It guides readers through the complete process, from asking the right questions and performing exploratory data analysis to modelling, interpreting results, communicating findings, and considering ethical implications.
The aim of this learning material is aligned with the Australian Actuaries Institute’s Part II Data Science Principles syllabus.
“The Data Science Principles aim to extend students’ knowledge of modern analytical tools and techniques beyond those introduced in the Foundation Program subjects and to teach students how to apply this knowledge in real-life business settings”
Actuaries Institute, Data Science Principles syllabus
Data science is an interdisciplinary field that covers many areas of knowledge, including but not limited to statistics, machine learning, databases, optimization, algorithms, programming, and domain knowledge in a business setting. This resource mainly focuses on applying the data analysis cycle with statistical machine learning techniques to address actuarial applications, referred to as Actuarial Data Science. The techniques and concepts introduced can be applied more broadly to other business problems and can also serve as a textbook for solving general business data problems.
It is often argued that data science is a discipline rooted in science and engineering, with a vast arsenal of quantitative tools. However, it is important to recognise that data science is also an art (Peng and Matsui 2015). While a wide range of analytical techniques, from linear regression to classification trees and deep learning, have been codified into software packages, the role of the data scientist extends far beyond selecting and running algorithms. Effective data science involves making numerous judgment calls throughout the problem-solving process, including choosing appropriate tools for specific tasks, interpreting results, communicating findings clearly to stakeholders, and embedding ethical and regulatory considerations into each decision. These nuanced aspects of data science, judgment, interpretation, and communication, remain, at least for now, beyond the capabilities of machines.
2 Pedagogical Design
2.1 From the Actuarial Control Cycle to the Data Science Lifecycle
Actuaries apply the Actuarial Control Cycle (ACC) for structured problem solving (Bellis et al. 2010). Figure 1 is adapted from the Actuaries Institute, based on Bellis et al. (2010).
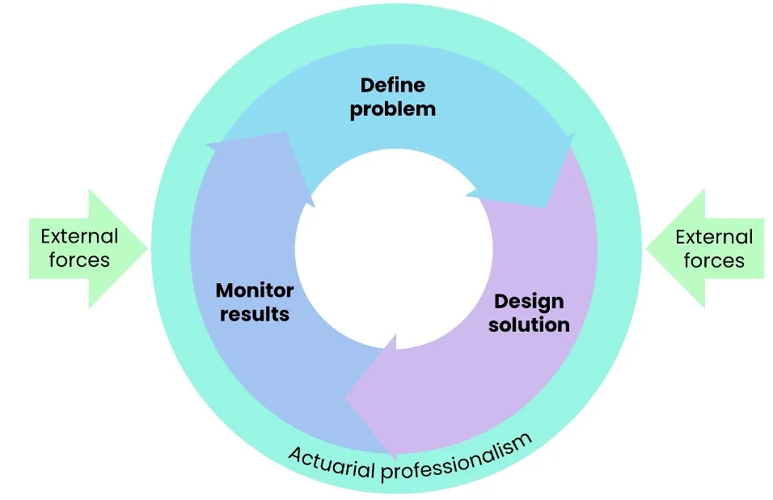
In a similar spirit, the OLR introduces the Data Science Lifecycle (DSL) as a practical methodology for tackling data-driven problems. While rooted in the principles of the ACC, the DSL reflects the unique, iterative, and often non-linear nature of data analysis. It comprises six key steps and serves as a tailored application of the ACC to the context of data science, as shown in Figure 2.
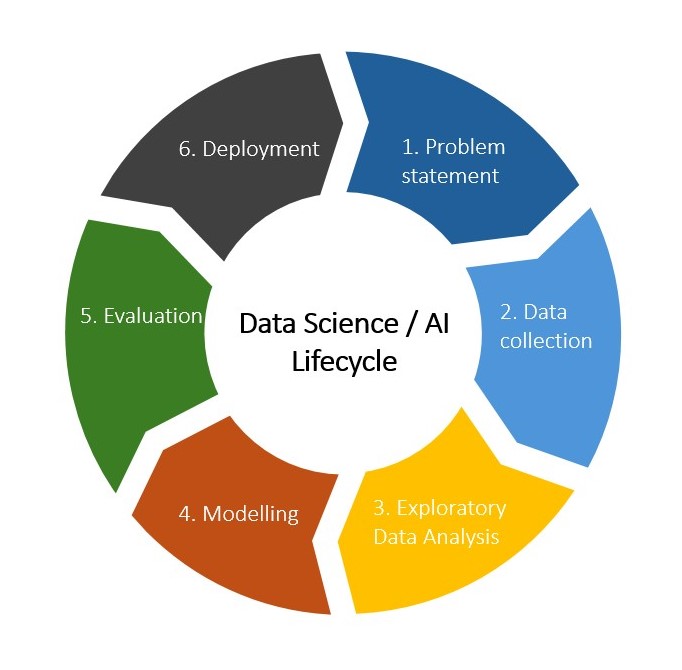
The six steps of the DSL are as follows.
- Problem statement
- Data collection
- Exploratory data analysis
- Modelling
- Evaluation
- Deployment
Throughout the entire process, ethical considerations and professional conduct are essential and must be integrated into every step. Just as importantly, each step of the DSL is grounded in a deep understanding of the business context. Without this, data science risks becoming disconnected from real-world impact. In the chapters that follow, communication and ethics are emphasised as core components that must be embedded into the lifecycle alongside the six steps.
2.2 Chapter roadmap
The chapters are organised as follows.
- Chapter 2 covers Step 1, focusing on how to ask the right question and frame it as a data science problem.
- Chapter 3 addresses Steps 2 and 3, including data collection and exploratory data analysis.
- Chapter 4 presents a range of modelling techniques, explaining when and how to apply them.
- Chapter 5 introduces a systematic evaluation toolbox for data-driven decision-making, with a particular focus on applications in the insurance sector.
- Chapter 6 explores effective communication strategies for engaging different stakeholders.
- Chapter 7 introduces the Ethical Data Science (AI) Lifecycle (EDSL), a framework for embedding ethical thinking across the entire DSL, including deployment considerations (Huang 2025).
Table 1 summarises the correspondence between lifecycle stages and chapter topics.
| DSL step | Chapter focus | Primary outputs for learners |
|---|---|---|
| Problem statement | Chapter 2 | Well-scoped analytical question, success criteria |
| Data collection & EDA | Chapter 3 | Clean datasets, exploratory visuals, quality checks |
| Modelling | Chapter 4 | Fitted models from shrinkage and GLMs to neural networks |
| Evaluation | Chapter 5 | Model comparison, validation, decision support |
| Communication | Chapter 6 | Stakeholder-ready narratives and visuals |
| Ethics (EDSL) | Chapter 7 | Responsible use, governance, deployment considerations |
2.3 Learning modes
The OLR supports three learning modes, listed on the companion website homepage.
- Lecture notes provide conceptual exposition, worked examples, and references for self-study or classroom delivery. Major lectures include recommended reading lists and learning objectives.
- Slide decks (Reveal.js HTML slides) support live teaching. Many can be exported to PDF.
- Labs provide hands-on exercises in R, implemented in R Markdown, so learners apply each lifecycle stage to structured datasets and produce reproducible reports.
This multi-format design allows the same content to serve flipped classrooms, self-paced learners, and instructors who want PDF handouts alongside interactive HTML.
3 Content Overview
3.1 Lectures
Table 2 lists the lecture materials by chapter, matching the structure on datascience.feihuang.org. All items are available as HTML. Most also have slide downloads, and Chapter 1 includes a PDF.
| Chapter | Lectures |
|---|---|
| 1, Introduction | Introduction to Actuarial Data Science |
| 2, Problem Statement | Problem Statement |
| 3, Data | Data Visualisation, Data Manipulation and Transformation, Data Collection and Cleaning |
| 4, (Predictive and Inferential) Modelling | Modelling and Shrinkage Techniques, GLM, Random Forest, Gradient Boosting Machine, Neural Networks |
| 5, Evaluation | Model Assessment and Selection |
| 6, Communication | Communication |
| 7, Ethics | Ethics (Ethical AI Lifecycle) |
Chapter 1 introduces actuarial data science as an end-to-end discipline. It presents the Actuarial Control Cycle and the Data Science Lifecycle, explains how the OLR is aligned with the Actuaries Institute Part II syllabus, and sets out the interdisciplinary foundations of the field.
Chapter 2 focuses on problem framing. It shows how to turn a vague business concern into a clear, answerable data science question, and why business objectives, constraints, and operating context must be understood before any data work begins.
Chapter 3 covers data work across three lectures. Data visualisation introduces exploratory graphics and the grammar of graphics. Data manipulation and transformation covers tidy data workflows in R. Data collection and cleaning addresses import, quality checks, and preparing analysis-ready datasets.
Chapter 4 is the technical core of the OLR. It opens with a map of statistical machine learning and the bias-variance trade-off, then covers shrinkage techniques (ridge, lasso, elastic net), generalised linear models for insurance, and tree-based and neural network methods, with worked examples throughout.
Chapter 5 introduces model assessment and selection. It covers bias-variance decomposition, in-sample and out-of-sample error estimates (including cross-validation and bootstrap methods), classification and regression metrics, and model assessment in a business context with segmented diagnostics.
Chapter 6 addresses communication. It explains how to present modelling results to different stakeholder audiences, link findings back to business objectives, and produce reproducible reports that support transparent, trustworthy analysis.
Chapter 7 covers ethics and responsible AI. It revisits the Data Science Lifecycle through the Ethical AI Lifecycle (Huang 2025), including fairness, transparency, accountability, discrimination in insurance pricing, and regulatory responses to algorithmic systems.
3.2 Labs
Table 3 lists the hands-on lab sequence from the companion website. Labs mirror the lecture progression and are designed to be completed in order, though instructors can assign subsets independently.
| Chapter | Lab topic |
|---|---|
| 1–2 | R Markdown introduction |
| 3 | Data visualisation, data manipulation and cleaning |
| 4 | Modelling and shrinkage, GLM, random forest, gradient boosting, neural networks |
| 5 | Evaluation |
Labs use real-world-style datasets and require learners to document code, results, and interpretation in reproducible R Markdown reports. This format deliberately reinforces communication skills alongside technical execution. A model that cannot be explained in writing is not ready for actuarial use.
3.3 Foundational references
The development of this course content has been informed by several key references, as well as other sources noted throughout the course materials.
- Wickham and Grolemund (2016) for data science workflow in R
- Peng and Matsui (2015) for the art of data science and problem-solving judgment
- James et al. (2021) for statistical learning foundations
- Hastie, Tibshirani, and Friedman (2009) for model assessment and selection
- De Jong and Heller (2008) for insurance-oriented GLM practice
- Bishop (2006) for regularisation
- Géron (2022) for modern machine learning implementation
Additional references appear in individual chapters where methods are introduced.
4 Industry Integration and the Actuarial Datathon
The Actuarial Datathon is an industry case competition embedded in the UNSW course Actuarial Data Science Applications (ACTL4305 / ACTL5305), which sits on the Actuaries Institute Part II Data Science Principles pathway. It is designed so that a single, coherent business challenge runs through the term while several partners contribute different lenses, including data and domain context, consulting practice, and entrepreneurship.
Industry partners have included insurers (providing business context and data for industry case challenges), consulting firms (providing thought leadership and guest teaching on insurance data science in practice), and venture capital firms (providing entrepreneurial perspective and hosting of the final pitch). Together, this mirrors how real projects sit at the intersection of data science, communication, innovation, and commercial decision-making.
Table 4 maps Datathon stages to OLR chapters. Open learners can treat the Datathon as the “spine” of the end-to-end workflow the materials teach, even without access to proprietary competition data.
| Course stage | What students practise in the challenge | OLR chapter |
|---|---|---|
| Problem framing & strategy | Defining the pricing problem, constraints, and competitive setting | Chapters 1–2 |
| Data | Working with internal and external data, quality checks, features | Chapter 3 |
| Modelling | Interpretable risk pricing, segmentation, model choice | Chapter 4 |
| Evaluation | Comparing approaches and defending choices under uncertainty | Chapter 5 |
| Communication & ethics | Storyline for stakeholders, responsible use of models and data | Chapters 6–7 |
In the live course, teams often operate like start-ups, building models, testing strategies in a simulated market (many notional competitors and customers), and presenting to an industry panel.
Table 5 lists industry-integrated projects from ACTL4305/5305 (Actuarial Data Science Applications, 2020–present) and ACTL3142/5110 (Statistical Machine Learning for Risk and Insurance Applications, 2021–2022), run through the Actuarial Datathon or Sandbox projects.
| Course | Year | Project | Partner(s) |
|---|---|---|---|
| ACTL4305/5305 | 2025 | Datathon, Travel insurance conversion, insights and growth opportunities | Freely, Zurich Cover-More, Taylor Fry |
| ACTL4305/5305 | 2024 | Datathon, Competing for pet insurance customers, a pricing competition | Fetch, AirTree, Finity |
| ACTL4305/5305 | 2023 | Sandbox, Understanding bushfire event risk across Australia | Suncorp |
| ACTL4305/5305 | 2022 | Sandbox, Multi-coverage claim modelling for insurance packaged products | IAG |
| ACTL4305/5305 | 2021 | Sandbox, Pricing models for SME building insurance with high-cardinality features | Suncorp |
| ACTL3142/5110 | 2022 | Sandbox, Predicting claims inflation for commercial auto insurance pricing | IAG |
For UNSW students, briefing packs, datasets, deadlines, and assessment weightings are published on the course Moodle page each term and may differ from earlier offerings. Use this OLR for methods. Use Moodle for the authoritative task sheet.
5 Supplementary Engagement, Teaching in Tune
Teaching in Tune is an AI-assisted playlist that turns quantitative ideas from machine learning into songs that are memorable, human, and fun to learn from. Tracks tie to ACTL4305/5305 (Actuarial Data Science Applications). Highlights include:
- From Data to Value. Course theme song. The core mission of actuarial data science is extracting value from data through careful analysis.
- Link It Right. An upbeat introduction to generalised linear models (GLMs).
- Don’t Overfit. A playful take on shrinkage (LASSO, ridge, elastic net) and the bias–variance trade-off.
- In the Forest of Trees (Random Forest). The random forest machine learning technique from the modelling topics in the course.
The playlist is embedded on the companion website homepage. Teaching in Tune is optional enrichment and does not form part of the core syllabus.
6 Implementation and Open Access
The OLR is built with Quarto, an open-source scientific publishing system that renders .qmd source files to HTML, PDF, and Reveal.js slide decks from a single project. This means lecture notes, slides, and PDF handouts share a single source of truth and are updated together. The live site is hosted at datascience.feihuang.org. Source is maintained in a public GitHub repository (github.com/feihuangFH/actuarial_data_science_course), where issues and suggested corrections can be submitted.
License. This repository includes references from other open books, each subject to their respective licenses. All materials created by the author are licensed under Attribution 4.0 International (CC BY 4.0). For more details, please refer to the LICENSE file included in the repository. Instructors are welcome to reuse, adapt, and redistribute materials with attribution.
Versioning. Version 1.0.0 was archived on Zenodo in June 2026 with a persistent DOI for stable citation. Future releases will receive incremented version numbers and new Zenodo records.
- Resource site. datascience.feihuang.org
- SSRN. papers.ssrn.com/sol3/papers.cfm?abstract_id=6955338
- Source repository. github.com/feihuangFH/actuarial_data_science_course
- Zenodo archive. https://doi.org/10.5281/zenodo.20718647
- License. CC BY 4.0
- Version. 1.0.0 (June 2026)
7 Limitations and Scope
This report is an overview of the OLR, not a substitute for the full materials. Technical depth, R code, datasets, and exercises reside on the companion website and in the Zenodo archive. The OLR focuses on statistical machine learning workflows implemented in R. It does not attempt comprehensive coverage of every data science topic, including large-scale distributed computing, deep learning at production scale, Python-based toolchains, or product-specific regulatory compliance across all jurisdictions.
The Datathon case studies described here reflect live UNSW course offerings. Partner firms, datasets, and competition formats change from year to year. Open learners should expect OLR chapters to remain stable while live competition details vary.
8 Conclusion
Actuarial Data Science provides a structured, openly licensed path through modern data science for actuarial and insurance contexts. By organising content around the Data Science Lifecycle, pairing lectures with reproducible labs, covering the full modelling pipeline from shrinkage and GLMs through ensemble methods and neural networks, and connecting methods to an industry-integrated Datathon, the resource addresses a gap between technique-focused textbooks and the integrated workflow actuaries use in practice. The companion website and Zenodo archive make all materials freely accessible and citable for teaching, self-study, and reference.
9 Acknowledgements
This online textbook is developed for teaching the course “Actuarial Data Science Applications” (coded as ACTL4305 and ACTL5305) at UNSW Sydney.
The author expresses gratitude to tutors of the courses ACTL4305/5305, Yumo Dong, Xi Xin, and Salvatory Kessy, for their invaluable contributions in developing the lab materials. Special thanks to Xi Xin for his critical and comprehensive review of the materials.
A special thanks to all the students who have taken this course from 2020 to the present, whose feedback and engagement have greatly enhanced the course over the years.
The author also extends appreciation to Dr. Patrick Laub for his assistance in building the course website using Quarto.